

Over the past few weeks, we have scaled our cloud from only a couple hundred billion tokens a day to more than three trillion tokens a day. Needless to say, this has been an enormous engineering challenge, requiring the team and I to work constantly. For those who have lived through major scaling events, you know well the sound of a pager waking you up night after night. Through these challenges, we have maintained a 99% uptime for our clients, as well as averaging roughly 97% KV Cache hit rate. While our cloud remains closed-source, we have benefited greatly from others sharing their knowledge freely online and in that spirit I wanted to share our learnings so others can learn from what we did well and avoid mistakes that we made early on.
The Scale and Statistics of Our Traffic
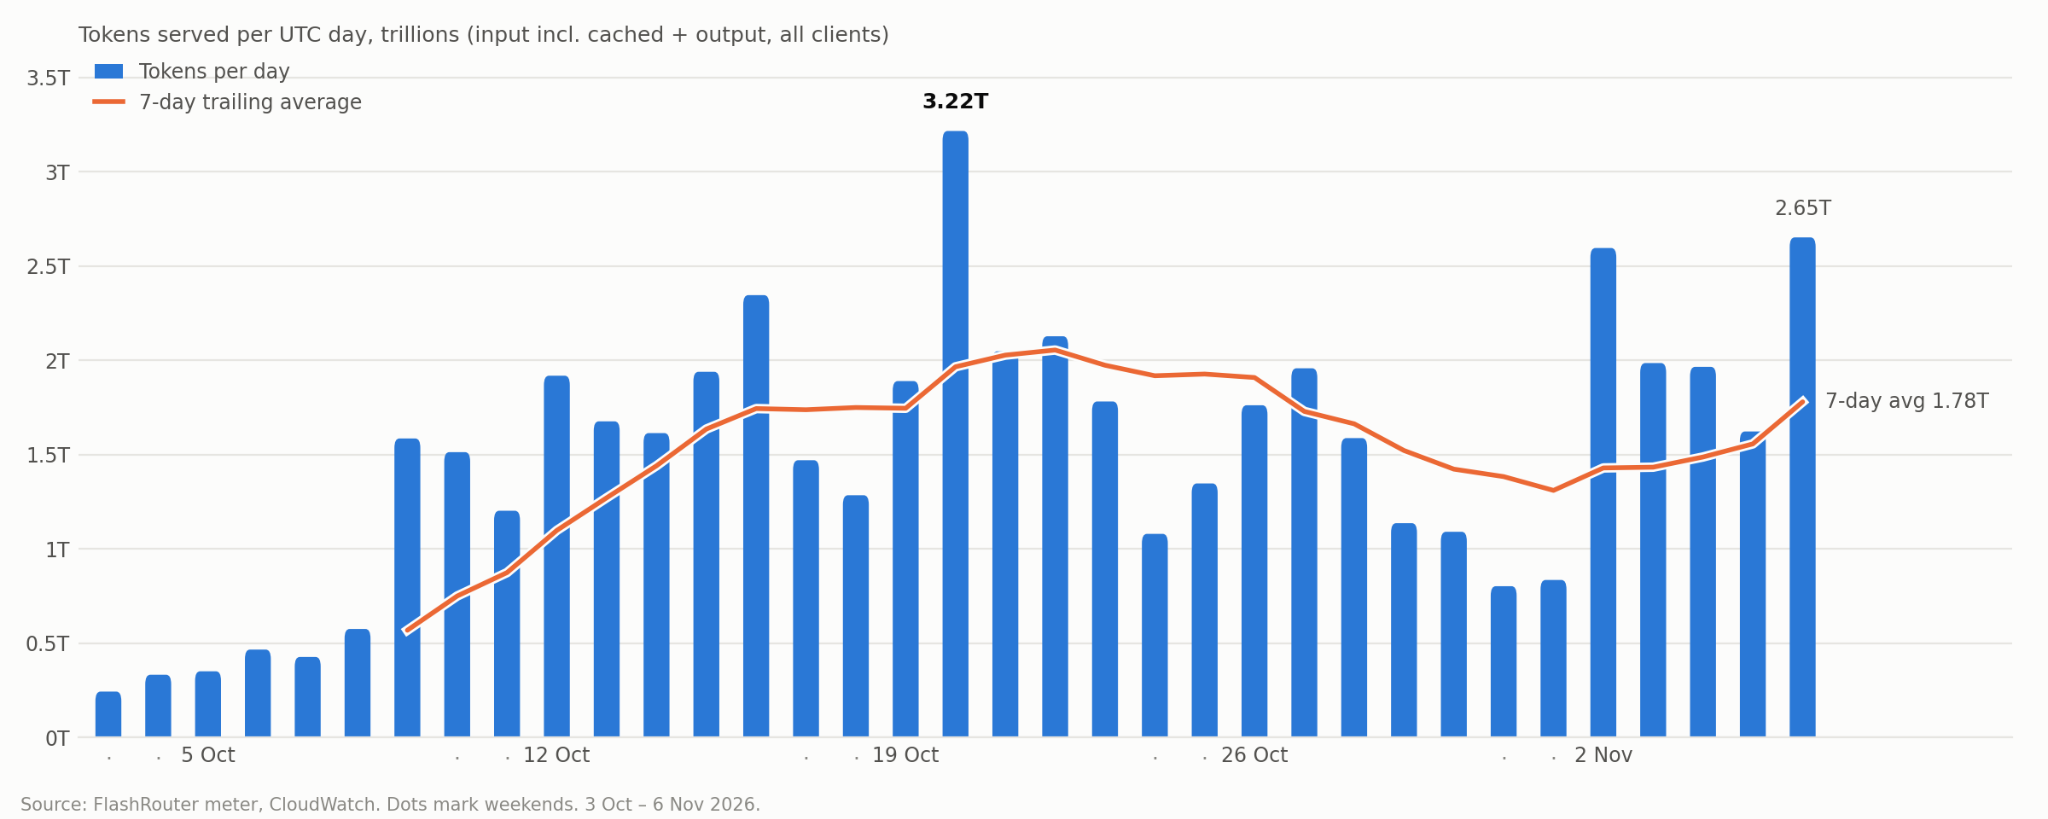
The graph above shows our actual traffic as we were hitting scale. On our peak day the router admitted 31.2 million requests and 3.22 trillion tokens of input and output. Since the spike, we’ve averaged 1.67 trillion a day with a weekday peak of 2.6 trillion (traffic drops a good bit on weekends, I guess even AI needs a break!). Critically for our customers, roughly 97 percent of those tokens were served from a KV cache rather than computed.
What does all this traffic actually look like? A request from our clients averages about 85,000 input tokens, with a median prompt of 146,000 tokens, a p90 of 276,000 and a maximum of 550,000. This means both that we need to store billions of KV Cache tensors in the system and that if we have a miss, the scale of recomputation means our TTFT suffers enormously. Every request body we process is roughly 2.0 MB. At our weekday average of about 9,000 requests a minute, that is 18 GB of request bodies entering the system every minute, 2.5 Gbps sustained, before a single token is generated.
When you are scaling as fast as we were, your gold-star for quality are your SLAs. Most of these fall on three axes: Time Per Output Token, Time To First Token, and KV Cache Hit Rate. We’re going to talk about how we’ve ensured quality around KV Cache and TTFT (as kernels are the key to TPOT).
A 97 % KV cache hit rate
A cache hit is the whole economics of this workload. DeepSeek’s public price for cached input is 50 times lower than for uncached input ($0.003 versus $0.15 per million tokens off-peak). At 160,000 tokens a turn, a warm turn costs roughly $0.0005 of input and a cold one $0.02 to $0.05. One point of hit rate lost on a 97 percent workload is about 20 percent more cost on that answer, because the uncached share goes from 3 to 4 percent of a very large number.
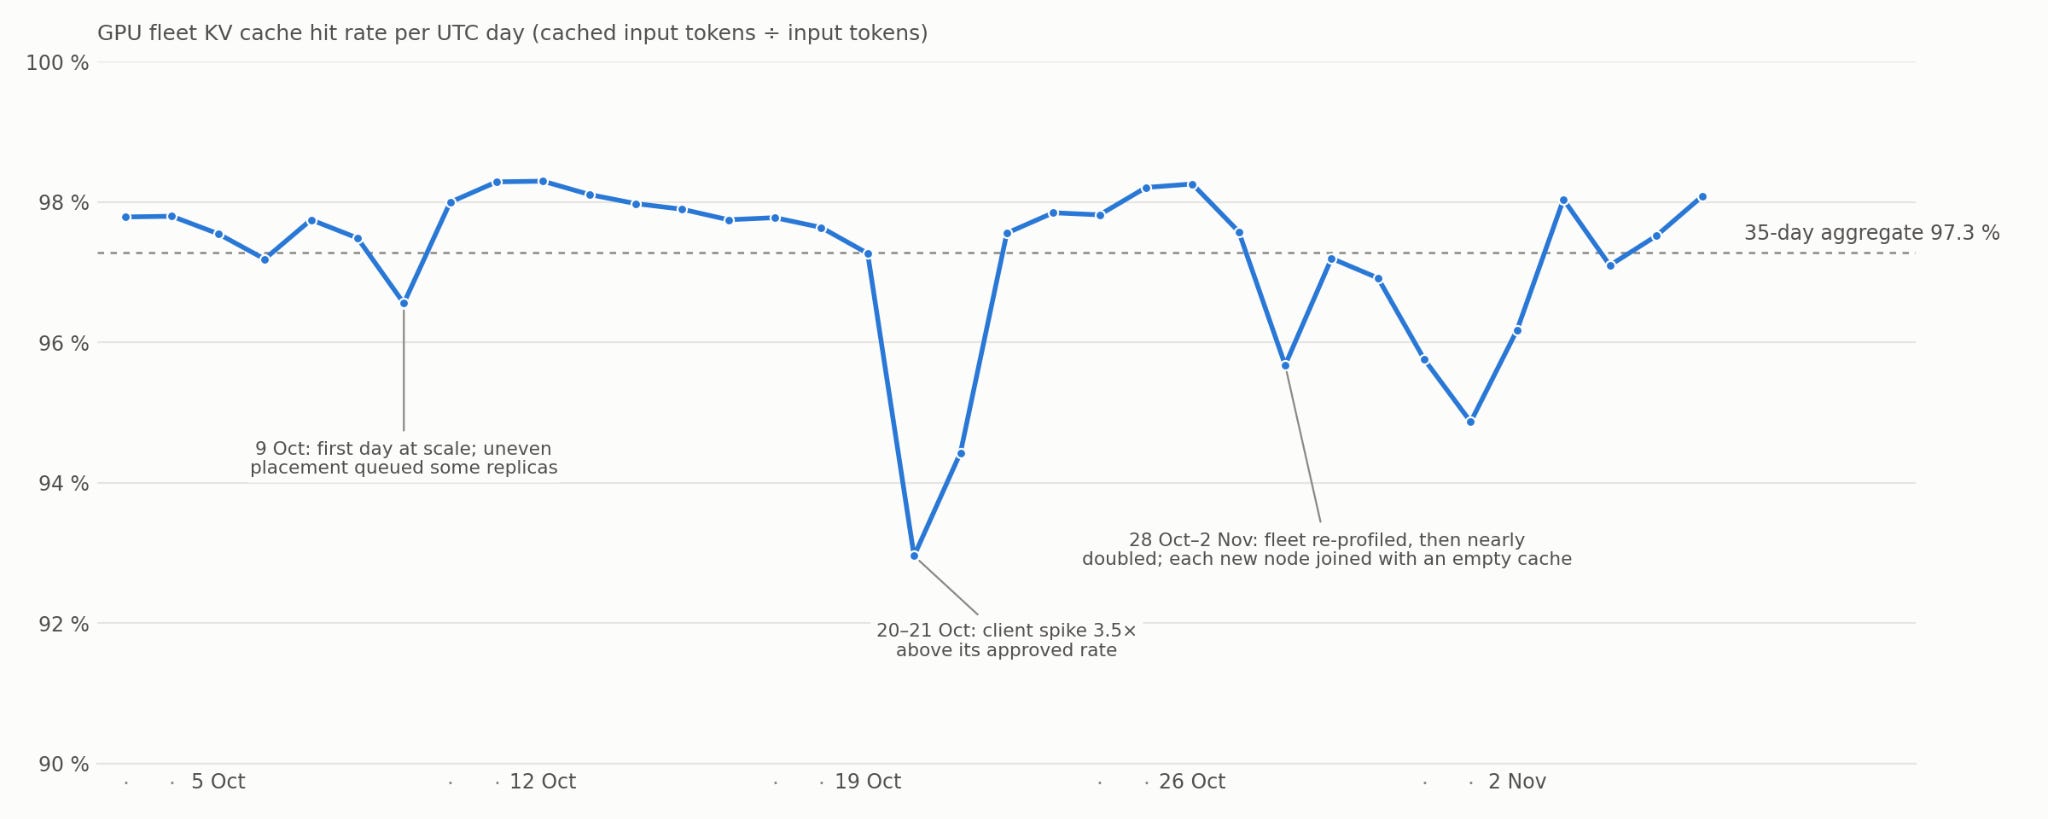
The fleet’s hourly hit rate aggregated to 97.3% throughout this massive scaling. Hitting that rate forced us to figure out two major techniques.
2.1 Seats, not requests
The standard unit to track for a SaaS company is requests. You are billed by this and rate limited at this. While requests are still relevant for inference, they are the wrong unit to focus on when it comes to KV Cache. This is because all requests are not equal. A turn that continues a conversation the fleet has already seen costs a few thousand uncached tokens of prefill. A turn that starts a conversation, or moves one to a replica that has never seen it, costs the whole transcript, about 146,000 tokens at our median. A request counter cannot tell the two apart, and it is the second kind that saturates a fleet.
So the fleet’s admission unit is a seat, where a seat is a live conversation rather than a request. The router keeps a notebook of conversations it has placed on the GPUs. On every request it looks the conversation up by its id (more on this later). A conversation that holds a seat goes to the GPUs for its whole life, whatever the load; the seat counts as occupied for five minutes after its last turn and the row is remembered for an hour. A conversation that has no seat gets one only if the alias is under its cap and the GPUs can take it right now. If the cap is reached, that turn is rejected and no row is written, so the conversation is not pinned cold to the wrong side and can claim a freed seat on a later turn. A seat is never written for a turn the GPUs did not actually serve.
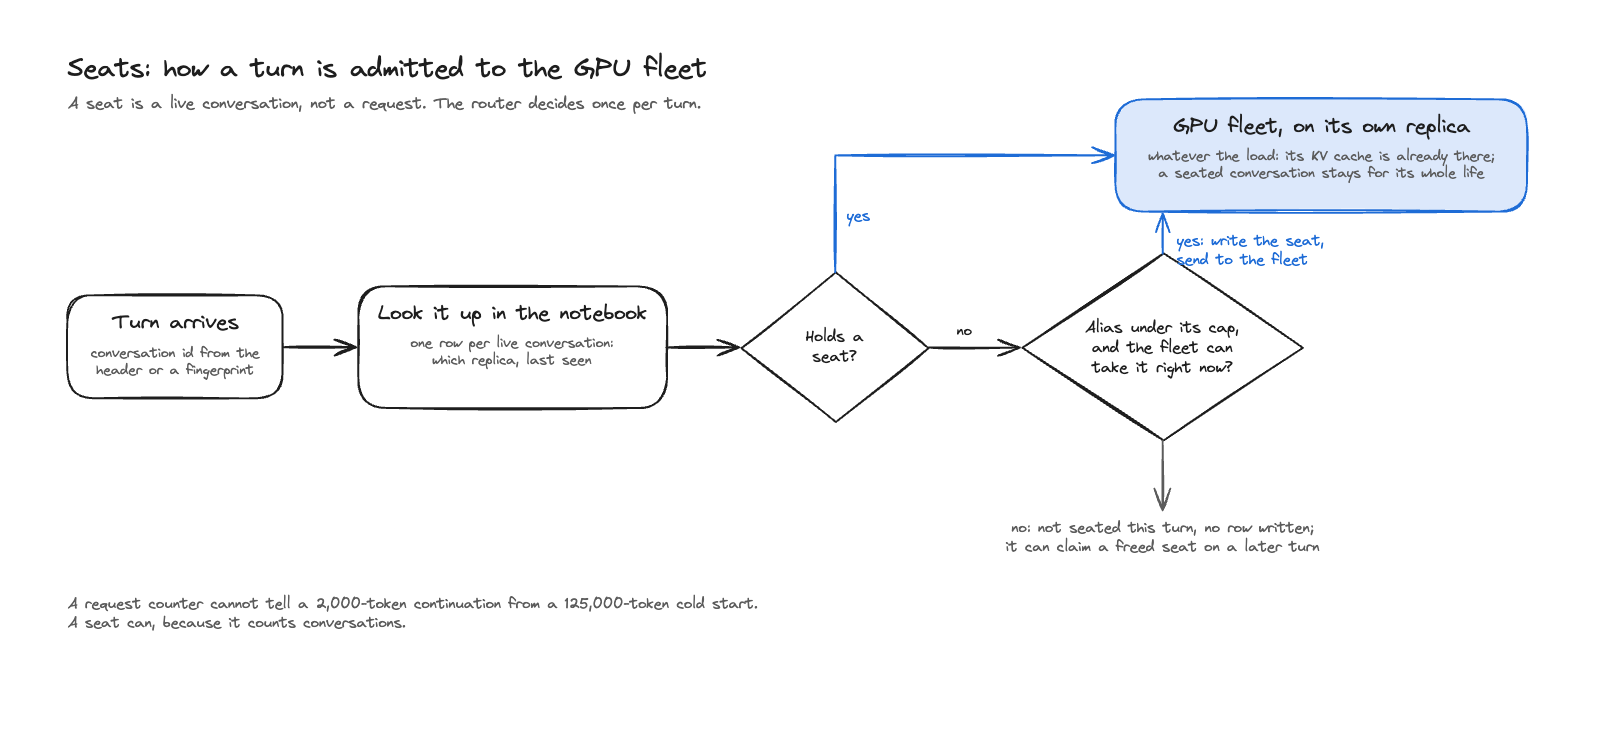
Seats work well because they help us identify live conversations while giving us a controlled means to decide when a KV cache should be considered evicted. By having a time-limit associated with the seat we can more precisely control our KV cache evictions and thus have a higher chance of having kv cache hits on our system.
Three other levers were considered here:
An in-flight cap. This is the typical SaaS unit. It fails because it cannot differentiate between requests with lots of cold prefill and ones without.
A cold-request budget. Counting uncached tokens per minute and refusing above a line. The right physics, but the router does not know a request’s cached count until the engine answers, so it would be estimating from the body. We found that the prediction engines so far have not added significantly better throughput to the system than our simple seat approximation has.
Pre-warming. Prefill a conversation on the fleet before moving it, so the move is never cold. This is something we’re actively working on implementing but naturally implementing this without having degraded performance is quite complex.
We chose simplicity where possible on the cloud and found seats were the simplest and best solution.
2.2 Failover Routing
Each request needs to be assigned to a certain GPU worker so that our customers see the highest possible KV cache hit rate. There are times when GPU workers go down though and if you don’t plan for that it’s easy to cause cascading issues.
For example, if you have a ring setup, you will try one GPU worker and then when it fails send the request to the next GPU possible. This will result in a massive decrease in performance on the subsequent GPU. While the GPU is restarting you need some way to still service the requests without causing major issues. The best solution we’ve found is to spread the requests across the fleet and then once the new GPU comes back online to reroute them back to the original worker. The natural scale up of traffic helps avoid KV cache throttling.
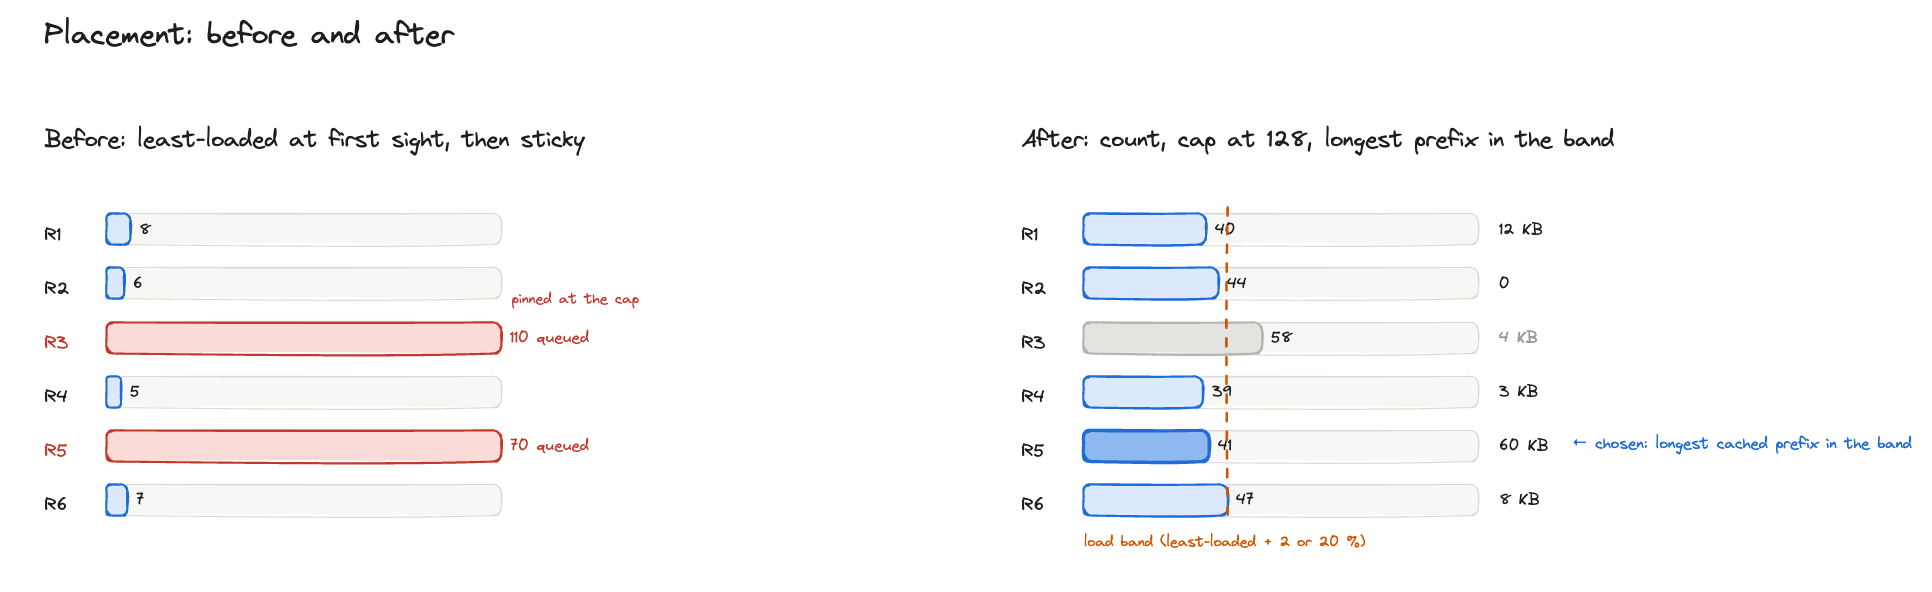
The first day of major scaling, placement was “stick to the least-loaded replica at first sight”. Under real load that left a few replicas pinned at their sequence cap with queues of 50 to 130 requests while others sat idle. These overloaded replicas were seen as “crashed” and the bad behavior would just jump around our nodes. The fix was two simple rules. One, count your own in-flight requests per replica rather than asking the engine, and two cap them. You have to count them to avoid weird delays with your metrics engine (especially around the running requests which change rapidly) and you cap them to avoid slipping on the throughput-interactivity curve. If two requests are competing, the longest cached prefix is the winner inside that band. The next day the fleet was at 98.0 percent and stayed there for a week.
TTFT Protections
Time To First Token is greatly impacted by KV cache hits. So much so that we have a special name for requests that are likely to have a low KV cache hit rate: cold prefill. Handling these is one of the most important skills.
When a cold prefill request hits your service, you have to do the prefill work for most (if not all) of the tokens sent. Compared to a regular request, this is dramatically more work and poses unique issues for certain topologies ( send me a DM if you know about this and want to work with us on improving this! ). While a few cold prefills are not necessarily an issue, many cold prefill requests sent in short order will cause degradations for other requests. Thus, spreading them out among your workers is not only a nicety, it is genuinely required for maintaining SLA. In this way, the incentive of a massively scaling inference provider and its clients are perfectly aligned: a high KV cache hit rate costs less for the client and helps the inference provider service more requests within SLA.
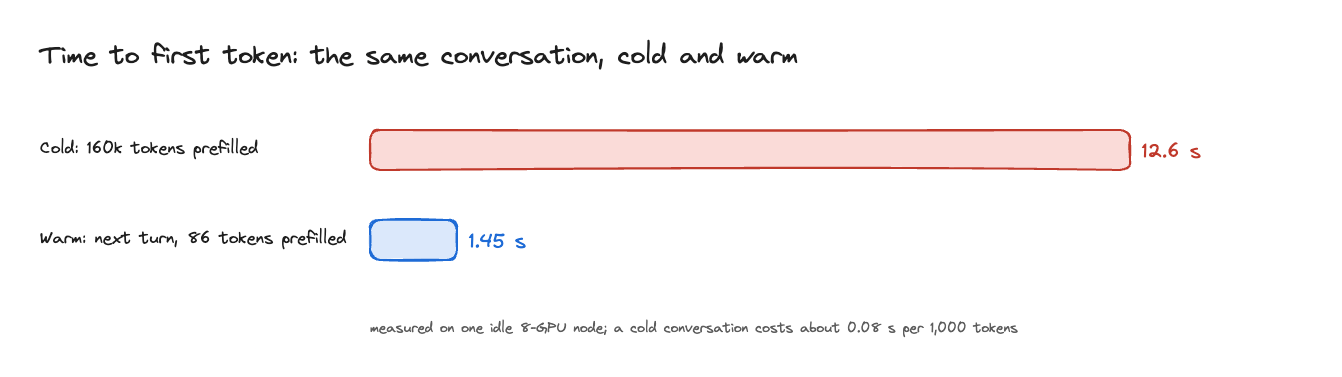
I think numbers really make clear what a difference KV cache makes for TTFT. We’ve seen in testing that the median time to first token ranges from 0.6 seconds to 12 when cold requests arrive faster than the fleet could prefill them. During this test the KV-usage gauge read 3 to 5 percent, because the engine was spending its time prefilling rather than holding.
So the unit of load on this workload is cold conversations per minute, and it is the number every admission decision in the above section is built to bound.
In one week we changed the engine profile on every node and then grew the fleet by most of its size again. Each step was a cache event: a re-profiled replica restarts empty, a new node joins empty, and the placement ring reshuffles a share of existing conversations onto it, each of which is a cold prefill. The series sat one to two points under the aggregate for six days and was back at 98 percent on 3 Nov. What we learned: capacity changes have a hit-rate cost proportional to the share of conversations that move, so the way to add capacity is slowly. The comparison that made this concrete was 14 Oct, when a single step change in traffic share moved about 325 conversations at once and the hit rate fell to 80 to 91 percent in minutes; spread over a week, nearly doubling the fleet cost about two points. What we did: fleet changes now go node by node through a drain, offline, prepare, admit sequence fenced by a single rollout lease that fails closed if interrupted, so a broken node is never admitted by accident; and traffic onto a new stateful router moves 10 percent every six minutes rather than all at once.
The network to the GPU is part of the model
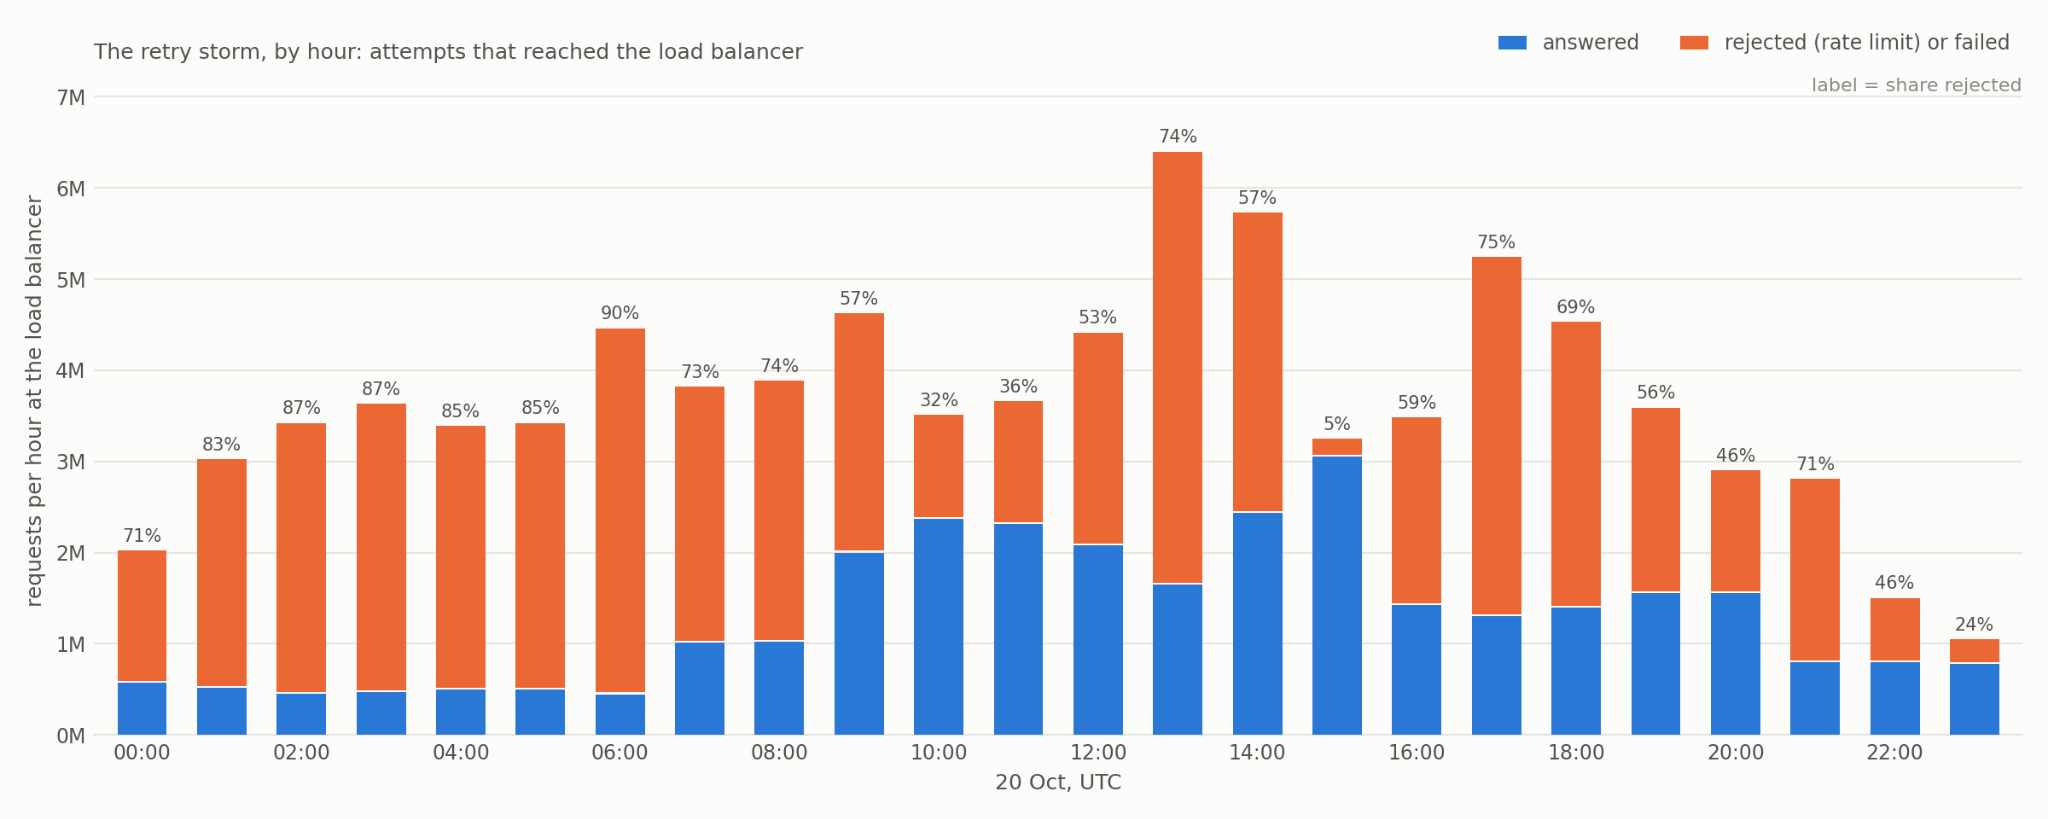
As we began processing more data we found the first wall at the routers. Our average request body is between 0.8 to 2.0 MB. During a major scale up, we began saturating our routing CPU’s NIC well before its cores were saturated. As a result of the NIC saturation, Outbound connections to our fleet starved on the same saturated link.
On 19 October one client began sending 3.5 times its approved rate. There were a few novel problems this introduced outside of just system saturation. First, when you are sending so many more requests, your proportion of cold prefills sky rockets. This naturally means that if you are not properly protecting your system you will see systemic degradation in interactivity. The solution here is to rate-limit based off seats and expected cold prefill tokens hitting the system. Second, our NIC saturation gets driven largely by the retry policies of the agents. By sending back 429s with ‘Retry-After’ Headers, you have to be aware that these will be followed by most OpenAI-API Clients. Consequently you are likely to see massive build-ups in traffic that you simply cannot fill during these periods. Naturally because the ‘Retry-After’ header is set to a static number, you’ve actually made your situation worse by having the traffic hit you all at once. The solution here is to spread out the Retry-After values so that all responses don’t come back at the same time. Naturally clients are not forced to respect that, but this is why you can ban poorly behaving clients as a last resort.
Conclusion
In closing, our cloud continues to scale up and we continue to face new and interesting challenges in serving inference at scale.
If you are interested in working at the forefront of inference (especially around heterogeneous hardware), send us a DM!